条形图是表示数据的最有效方式之一。它可以用于以视觉形式总结大量数据。
条形图能够表示随时间变化的数据,这有助于我们可视化趋势。
在 R 中创建条形图
在 R 中,我们使用 barplot() 函数来创建条形图。例如:
temperatures <- c(22, 27, 26, 24, 23, 26, 28)

# bar plot of temperatures vector
result <- barplot(temperatures)

print(result)
输出
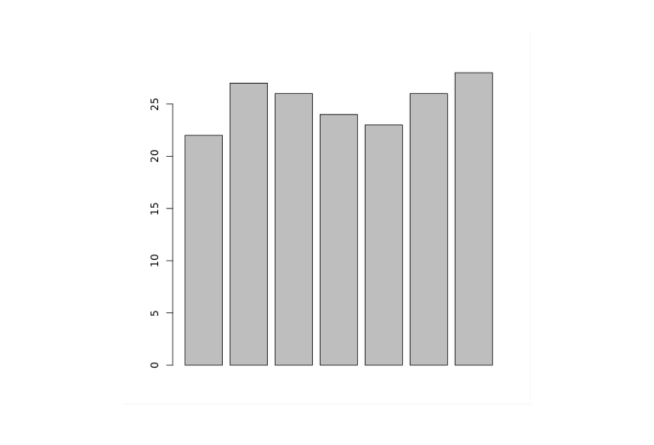
在上面的示例中,我们使用 barplot() 函数创建了 temperatures 向量的条形图。
我们上面创建的条形图很普通,我们可以为条形图添加很多内容。
在 R 中为条形图添加标题
要为 R 中的条形图添加标题,我们将 main 参数放在 barplot() 函数内部。例如:
temperatures <- c(22, 27, 26, 24, 23, 26, 28)

result <- barplot(temperatures,
  main = "Maximum Temperatures in a Week")

print(result)
输出
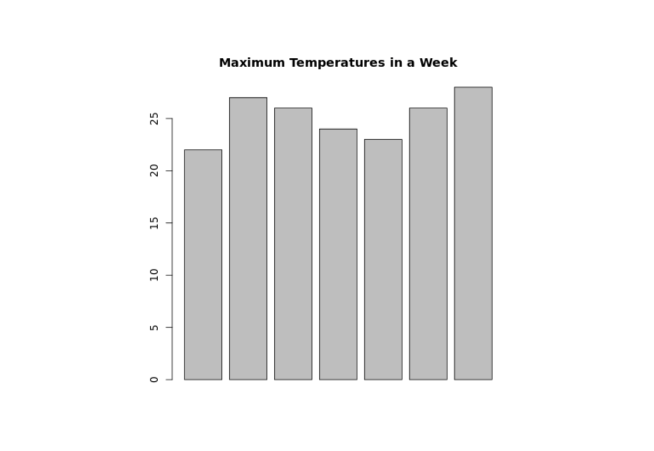
在上图中,我们可以看到我们为 temperatures 向量的条形图添加了标题。
barplot(temperatures, main = "Maximum Temperatures in a Week")在这里,main 参数将标题 "一周最高温度" 添加到我们的条形图中。
在 R 中为轴提供标签
在 R 中,我们也可以为 x 轴和 y 轴提供标签。例如:
temperatures <- c(22, 27, 26, 24, 23, 26, 28)

result <- barplot(temperatures,
  main = "Maximum Temperatures in a Week",
  xlab = "Degree Celsius",
  ylab = "Day")

print(result)
输出
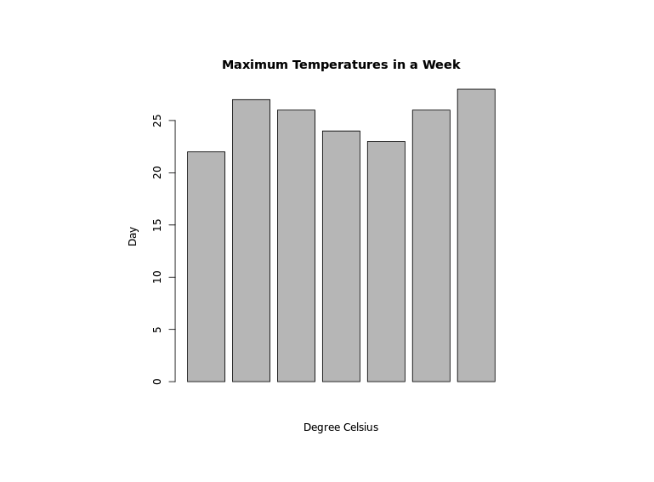
在上面的示例中,我们分别提供了 x 轴和 y 轴的标签。
barplot(temperatures,
  ...
  xlab = "Degree Celsius",
  ylab = "Day")
在这里,我们向 barplot() 添加了额外的 xlab 和 ylab 参数。
xlab- 为 x 轴提供"摄氏度"标签ylab- 为 y 轴提供"天"标签
在 R 中为条形图的每个条形提供名称
我们将 names.arg 参数放在 barplot() 内部,以便在 R 中为每个条形提供名称。例如:
temperatures <- c(22, 27, 26, 24, 23, 26, 28)

result <- barplot(temperatures,
  main = "Maximum Temperatures in a Week",
  xlab = "Degree Celsius",
  ylab = "Day",
  names.arg = c("Sun", "Mon", "Tue", "Wed", "Thu", "Fri", "Sat")
)

print(result)
输出
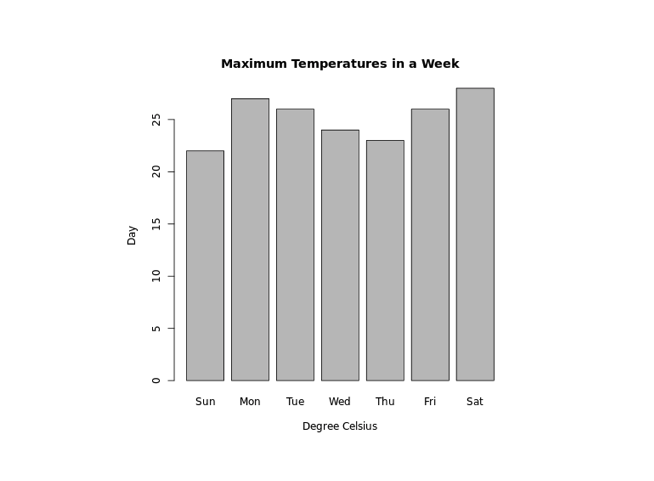
在上面的示例中,我们使用 names.arg 参数为条形图的每个条形提供名称。请注意代码:
barplot(temperatures,
  ...
  names.arg = c("Sun", "Mon", "Tue", "Wed", "Thu", "Fri", "Sat")
)
在这里,我们为第一个条形分配了 "Sun",为第二个条形分配了 "Mon",以此类推。
更改 R 中的条形颜色
在 R 中,我们将 col 参数放在 barplot() 内部以更改条形的颜色。例如:
temperatures <- c(22, 27, 26, 24, 23, 26, 28)

result <- barplot(temperatures,
  main = "Maximum Temperatures in a Week",
  xlab = "Degree Celsius",
  ylab = "Day",
  names.arg = c("Sun", "Mon", "Tue", "Wed", "Thu", "Fri", "Sat"),
  col = "blue"
)

print(result)
输出
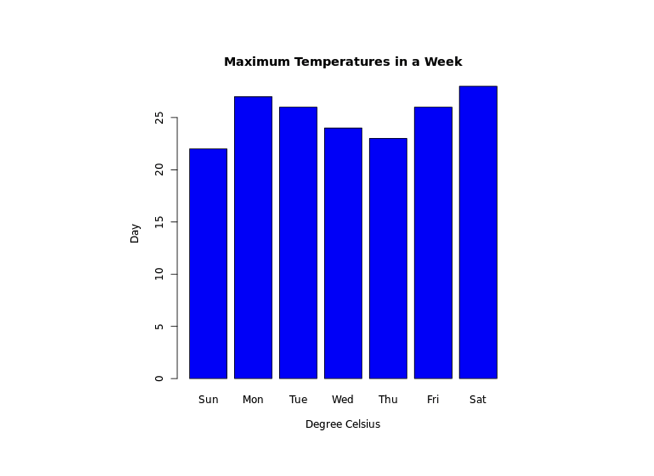
在上面的示例中,我们使用 barplot() 内部的 col 参数来更改条形的颜色。
result <- barplot(temperatures,
  ...
  col = "blue"
)这里,col = "blue" 将条形的颜色更改为蓝色。
R 中的条形纹理
要更改 R 中条形的纹理,我们将 density 参数放在 barplot() 内部。例如:
temperatures <- c(22, 27, 26, 24, 23, 26, 28)

result <- barplot(temperatures,
  main = "Maximum Temperatures in a Week",
  xlab = "Degree Celsius",
  ylab = "Day",
  names.arg = c("Sun", "Mon", "Tue", "Wed", "Thu", "Fri", "Sat"),
  col = "blue",
  density = 20
)

print(result)
输出
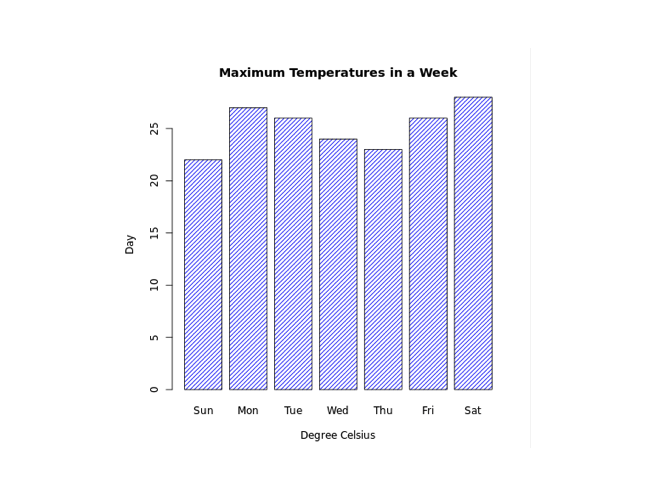
在上面的示例中,我们使用 barplot() 内部的 density 参数来更改条形的纹理。
result <- barplot(temperatures,
  ...
  col = "blue"
  density = 20
)这里,density = 20 为所有蓝色条形提供了密度为 20 的纹理。
在 R 中使条形图水平显示
在 R 中,要使我们的条形图水平显示,我们将 horiz 参数放在 barplot() 内部。例如:
temperatures <- c(22, 27, 26, 24, 23, 26, 28)

result <- barplot(temperatures,
  main = "Maximum Temperatures in a Week",
  xlab = "Degree Celsius",
  ylab = "Day",
  names.arg = c("Sun", "Mon", "Tue", "Wed", "Thu", "Fri", "Sat"),
  col = "blue",
  density = 20,
  horiz = TRUE
)

print(result)
输出
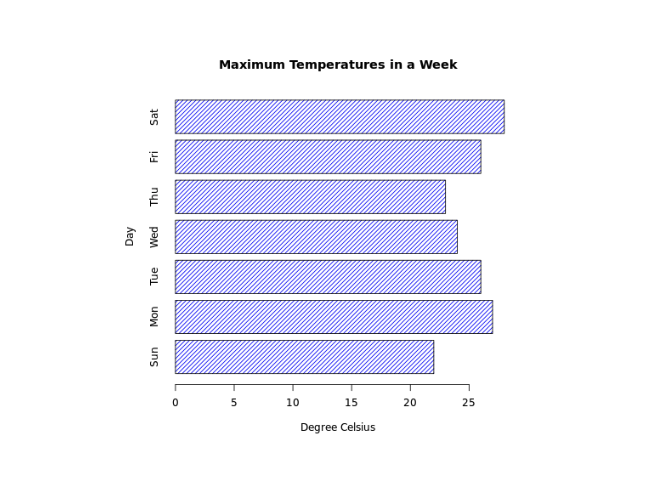
这里,在 barplot() 中传递的 horiz = TRUE 将我们图表的方向更改为水平。
R 中的堆积条形图
R 允许我们通过使用矩阵作为输入值来创建堆积条形图。例如:
# create a matrix
titanic_data <-  matrix(c(122, 203, 167, 118, 528, 178, 673, 212),
nrow = 2, ncol = 4)

result <- barplot(titanic_data,
main = "Survival of Each Class",
xlab = "Class",
names.arg = c("1st", "2nd", "3rd", "Crew"),
col = c("red","green")
)

legend("topleft",
c("Not survived","Survived"),
fill = c("red","green")
)

print(result)
输出
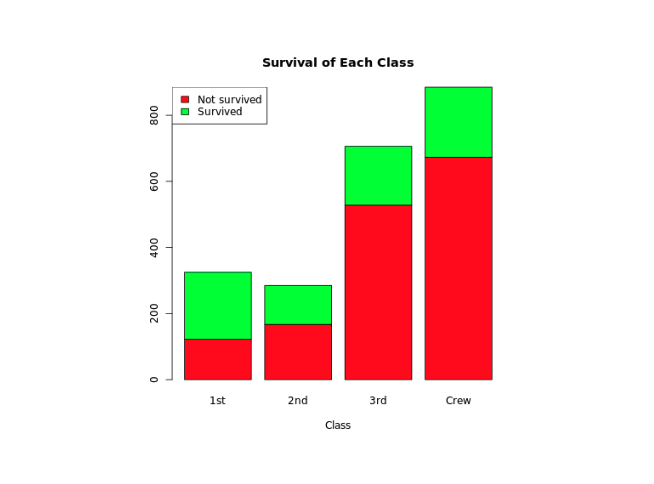
在上面的示例中,我们创建了一个名为 titanic_data 的矩阵,其中第一行包含未幸存者的数据,第二行包含幸存者的数据。
barplot(titanic_data,
  ...
)
在这里,我们已将 titanic_data 传递给 barplot() 以创建堆积条形图。
我们还使用了 legend() 函数为条形图添加图例。
"green"颜色代表"幸存""red"颜色代表"未幸存"。